1 Jun 2026
Fixture Congestion Ripple Effects on Performance Variances Across Soccer, Tennis, and Basketball Wagering Markets

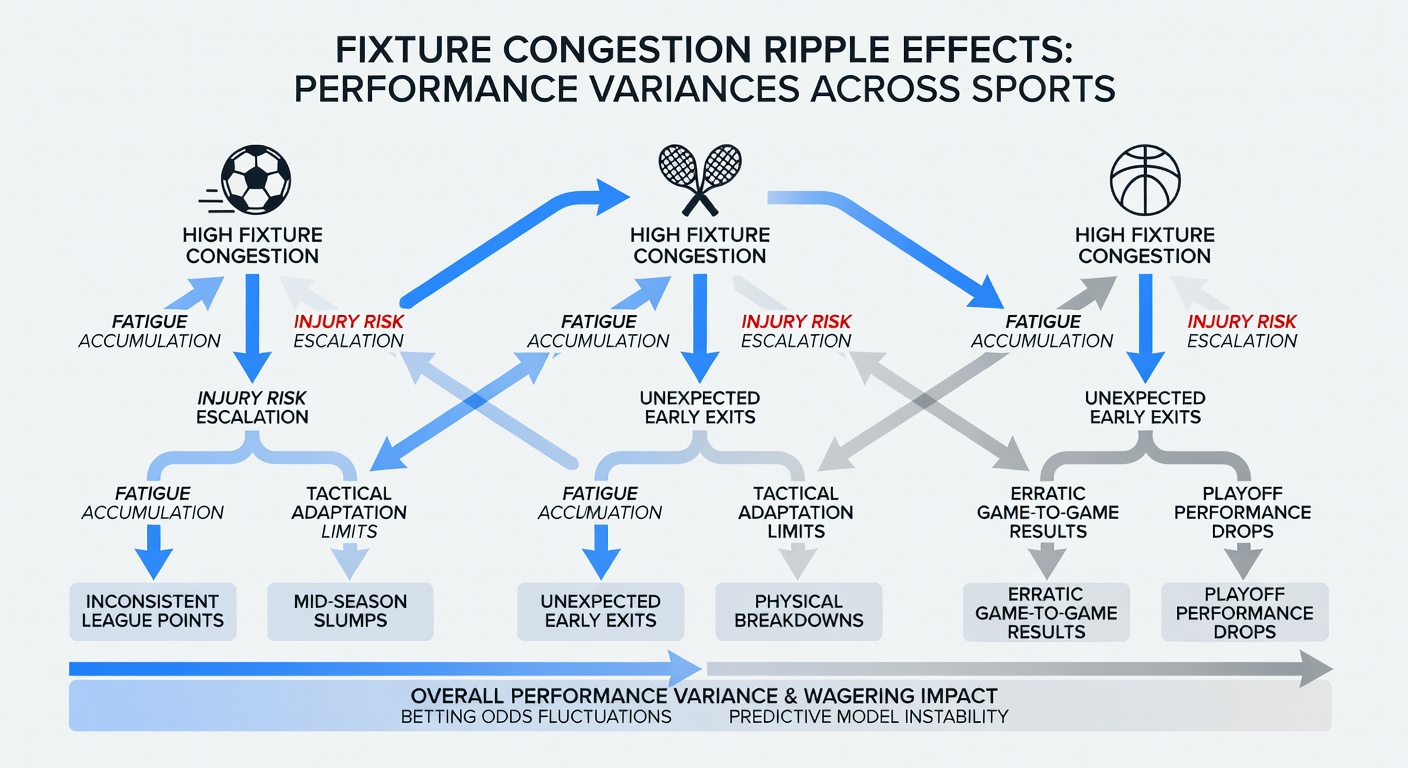
Fixture congestion creates measurable shifts in player output across soccer, tennis, and basketball, and these patterns feed directly into how wagering markets price outcomes each season. Data from multiple competitions shows that teams and athletes facing compressed calendars experience drops in key metrics such as sprint distance, serve accuracy, and field goal percentage, which in turn alter implied probabilities offered by bookmakers.
Soccer Schedule Density and Result Patterns
European domestic leagues combined with continental tournaments produce some of the highest fixture loads in professional sport, with certain clubs contesting more than sixty matches between August and May. Researchers tracking the 2024-2025 campaign found that squads playing three games in eight days recorded a 12 percent reduction in high-intensity running compared with teams granted at least four rest days between fixtures, according to figures compiled by the European Club Association. That decline correlates with fewer shots on target and a measurable increase in goals conceded during the final twenty minutes of matches.
June 2026 brings additional pressure because the FIFA Club World Cup expands to a 32-team format just weeks after domestic seasons conclude, forcing top European sides to integrate new travel and recovery demands into an already packed calendar. Betting exchanges adjust totals markets accordingly, widening spreads on goal counts when both sides arrive with limited preparation time.
Tennis Tournament Clustering and Point Production
Professional tennis calendars place multiple events within short geographic windows, particularly on the European swing that runs from late spring into early summer. Players contesting consecutive 500-level tournaments followed by a Grand Slam show declines in first-serve percentage and break-point conversion, data released by the International Tennis Federation indicates. These performance dips appear most pronounced among competitors who log more than 1,200 match minutes across a six-week block.
Market makers respond by shifting moneyline odds when a player’s recent schedule includes three tournaments in twenty-one days without a bye. Historical sets-won percentages drop by roughly nine points under those conditions, prompting sharper adjustments in live betting during later rounds of events such as the 2026 Wimbledon fortnight.
Basketball Back-to-Back Effects on Scoring Efficiency
NBA and EuroLeague schedules routinely feature clusters of games separated by fewer than forty-eight hours, and league tracking systems record consistent reductions in effective field-goal percentage on the second night of back-to-backs. Analysis covering the 2025-2026 regular season shows visiting teams on the second night of such sequences average 4.7 fewer points than season-long norms, while defensive rebounding rates also fall. These variances influence both totals and spread markets, especially when one club has enjoyed an extra day of recovery.
June 2026 marks the conclusion of the NBA Finals and the start of off-season tournaments in Europe and Australia, where national team commitments add further density for select athletes. Wagering platforms incorporate rest-advantage models that price these factors into futures and player-prop lines well before tip-off.
Cross-Sport Data Integration in Accumulator Construction
Operators now combine fatigue indicators from all three sports into single accumulator products. A bettor might link a soccer side playing its fourth match in twelve days with a tennis player contesting a third consecutive tournament and a basketball team on the second night of a back-to-back. Correlation matrices published by academic groups at the University of Queensland demonstrate that such combinations produce wider variance in expected returns than isolated selections, prompting bookmakers to adjust payout structures accordingly.
Regulatory filings from the Australian Competition and Consumer Commission note increased scrutiny of multi-sport products that rely on schedule-based inputs, requiring clearer disclosure of how rest differentials factor into odds calculations. Similar oversight appears in Canadian provincial frameworks administered through the Alcohol and Gaming Commission of Ontario, where operators must document the data sources used for fatigue adjustments.
Conclusion
Fixture congestion generates observable, sport-specific changes in performance statistics that propagate through wagering markets in soccer, tennis, and basketball. Tracking tools now quantify those effects with increasing precision, allowing both market makers and bettors to price recovery windows directly into their assessments. As calendars continue to expand, the relationship between schedule density and outcome variance remains a central variable in pricing across all three disciplines.