11 Jun 2026
Mileage markers: charting travel burdens on visiting sides in expansive league schedules
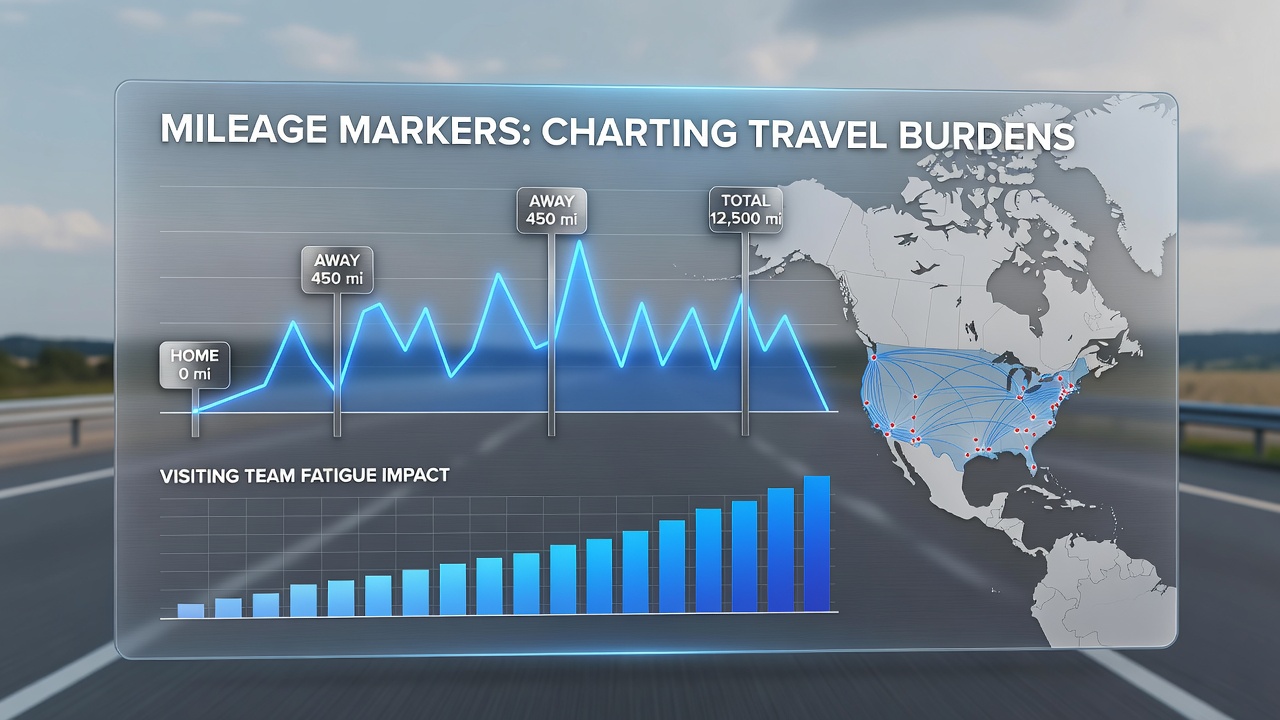
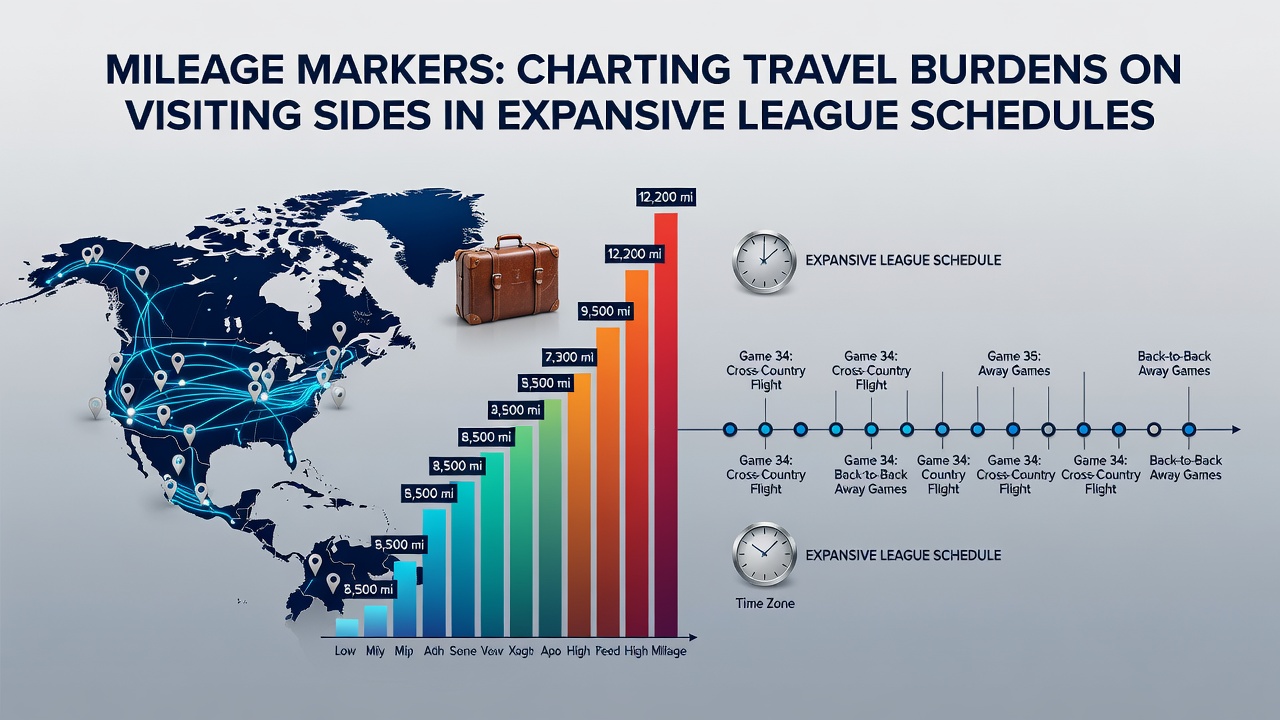
Expansive league schedules across professional and collegiate sports place significant demands on visiting teams through accumulated travel distances, and these patterns show measurable effects on performance metrics according to data compiled by various athletic associations. Researchers tracking team movements in basketball, football, and hockey leagues note that cross-country trips often exceed 3,000 miles per week during peak periods, with recovery windows compressed between games.
Schedule expansion and distance accumulation
Leagues have lengthened regular-season calendars in recent years to accommodate broadcast revenues and international competitions, which directly increases total mileage for road squads. In the NBA, for instance, teams averaged 42,000 miles traveled per season by the 2024-2025 campaign, with figures projected to climb further for June 2026 schedules that include additional back-to-back sets in western conferences. Observers note that eastern conference clubs face fewer transcontinental flights yet still log substantial bus and short-haul segments that compound fatigue over multi-week stretches.
Regional variations in travel load
Geographic spread within leagues creates uneven burdens, where western teams encounter longer flights to eastern venues while Canadian franchises manage border crossings that add logistical layers. Data from the Canadian Olympic Committee indicates that NHL clubs based in Vancouver or Edmonton accumulate 15 percent more air miles annually than those in the northeast corridor, correlating with shifts in game-day preparation routines. European football leagues present a contrasting model, where rail networks reduce some flight dependency, yet expansive Champions League commitments still force midweek continental hops that visiting sides must absorb alongside domestic fixtures.
Studies conducted through university sports science programs reveal consistent patterns in how travel distance interacts with time-zone changes, producing measurable drops in shooting accuracy and defensive reaction times for teams crossing multiple zones. One analysis of NCAA basketball contests showed visiting squads from Pacific time zones posting 4.2 percent lower field-goal percentages when playing on the east coast within 24 hours of arrival, a gap that narrows when rest periods extend beyond 48 hours.
Performance indicators tied to mileage
League tracking systems now incorporate mileage markers alongside traditional statistics, allowing analysts to quantify how accumulated distance influences outcomes in successive games. Australian Institute of Sport reports on rugby league competitions highlight that teams logging over 2,500 kilometers between rounds experience elevated rates of soft-tissue injuries, with hamstring strains rising by 18 percent compared to lower-travel periods. These datasets help coaching staffs adjust rotation patterns and training loads to offset the documented effects.
Football associations in South America have begun publishing aggregate travel reports that link high-mileage weeks to reduced possession percentages for visiting clubs, particularly in Copa Libertadores fixtures that span multiple countries. The patterns emerge most clearly during June international windows when club schedules overlap with national team duties, forcing additional flights that compound existing domestic burdens.
League responses and mitigation approaches
Some organizations have introduced schedule-balancing formulas that attempt to distribute long-haul trips more evenly across the calendar, yet implementation varies by sport and region. Major League Soccer schedules incorporate designated recovery days after extended road trips, while NBA officials continue to refine back-to-back restrictions following reviews of injury data collected through the 2025 season. These adjustments reflect ongoing efforts by league offices to address the structural travel demands inherent in geographically dispersed memberships.
Equipment and support staff logistics add another layer, with teams transporting medical supplies, film equipment, and nutrition stations that require coordinated ground transport once flights conclude. Industry reports from the National Athletic Trainers' Association document how these ancillary movements extend total operational hours for support personnel, indirectly affecting player readiness upon arrival at venues.
Future scheduling considerations
Planning documents released ahead of June 2026 seasons indicate continued scrutiny of travel equity, with proposals under discussion that include expanded use of charter flights and regional pod systems to limit extreme distance clusters. Academic researchers examining longitudinal datasets emphasize that monitoring tools now integrate GPS and sleep-tracking metrics, providing granular visibility into how individual athletes respond to specific mileage thresholds across different sports.
Conclusion
Comprehensive tracking of mileage markers across expansive league schedules reveals systematic patterns in how travel loads affect visiting sides, supported by data from athletic governing bodies and academic studies. As calendars continue to evolve, the integration of distance metrics into performance analysis provides clearer frameworks for understanding competitive dynamics without reliance on anecdotal observation alone.